Grafana
Grafana
Grafana can be used to build dashboards and visualizations that use Prometheus as the datasource. Create the grafana deployment and service.
kubectl apply -f addons/grafana -R
Use kubectl to authenticate to the apiserver and create a local port-forward to the Grafana pod.
kubectl port-forward grafana-POD-ID 8080 -n monitoring
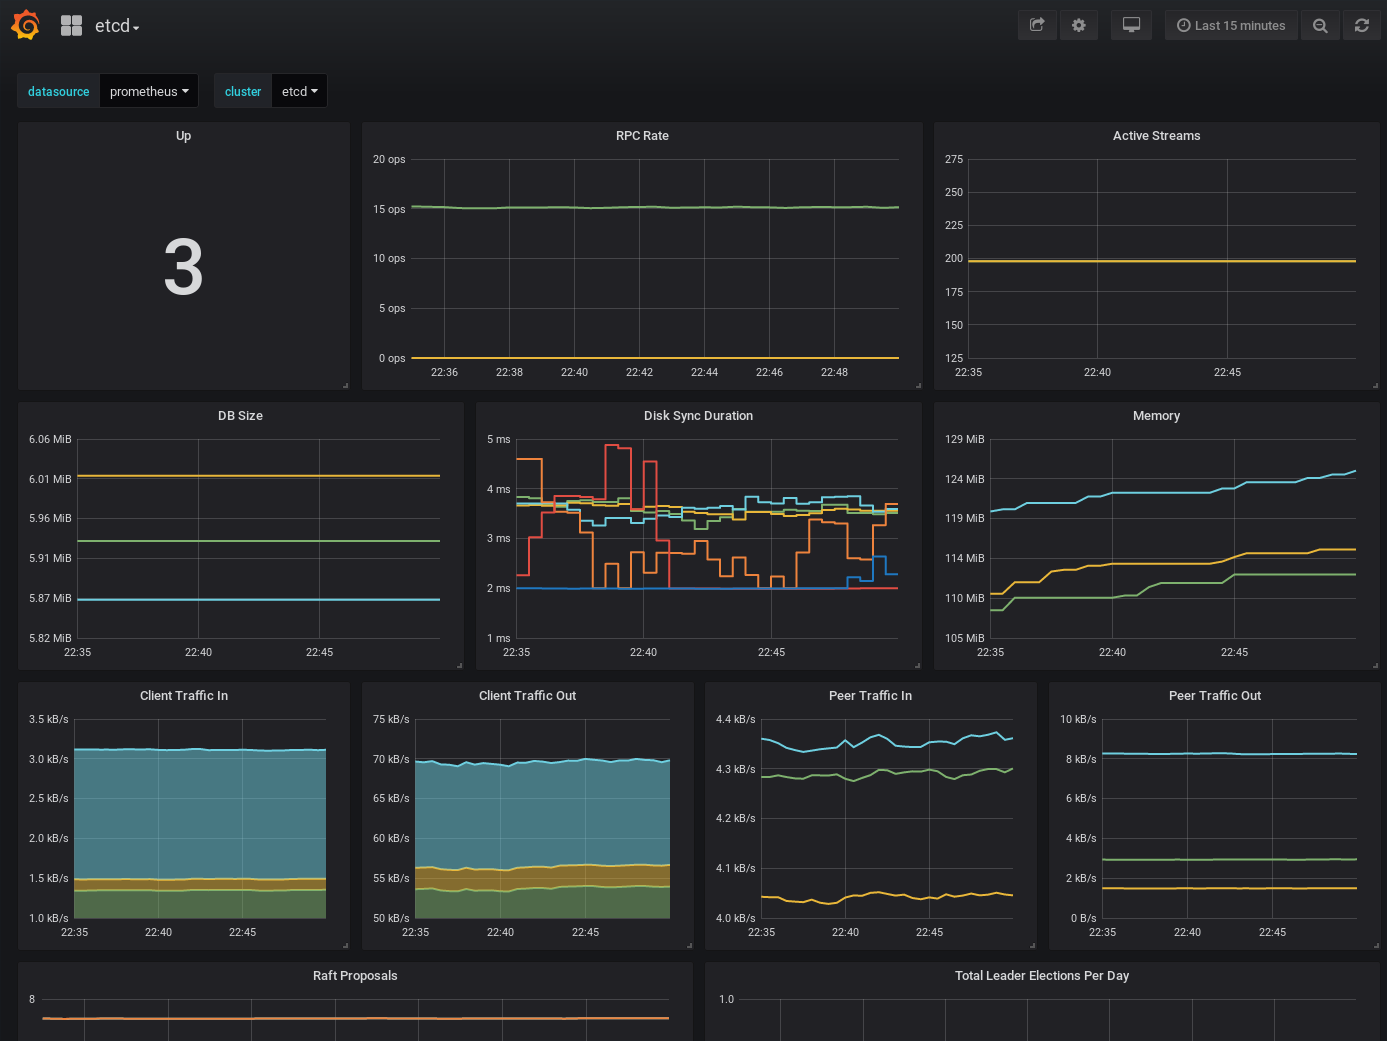
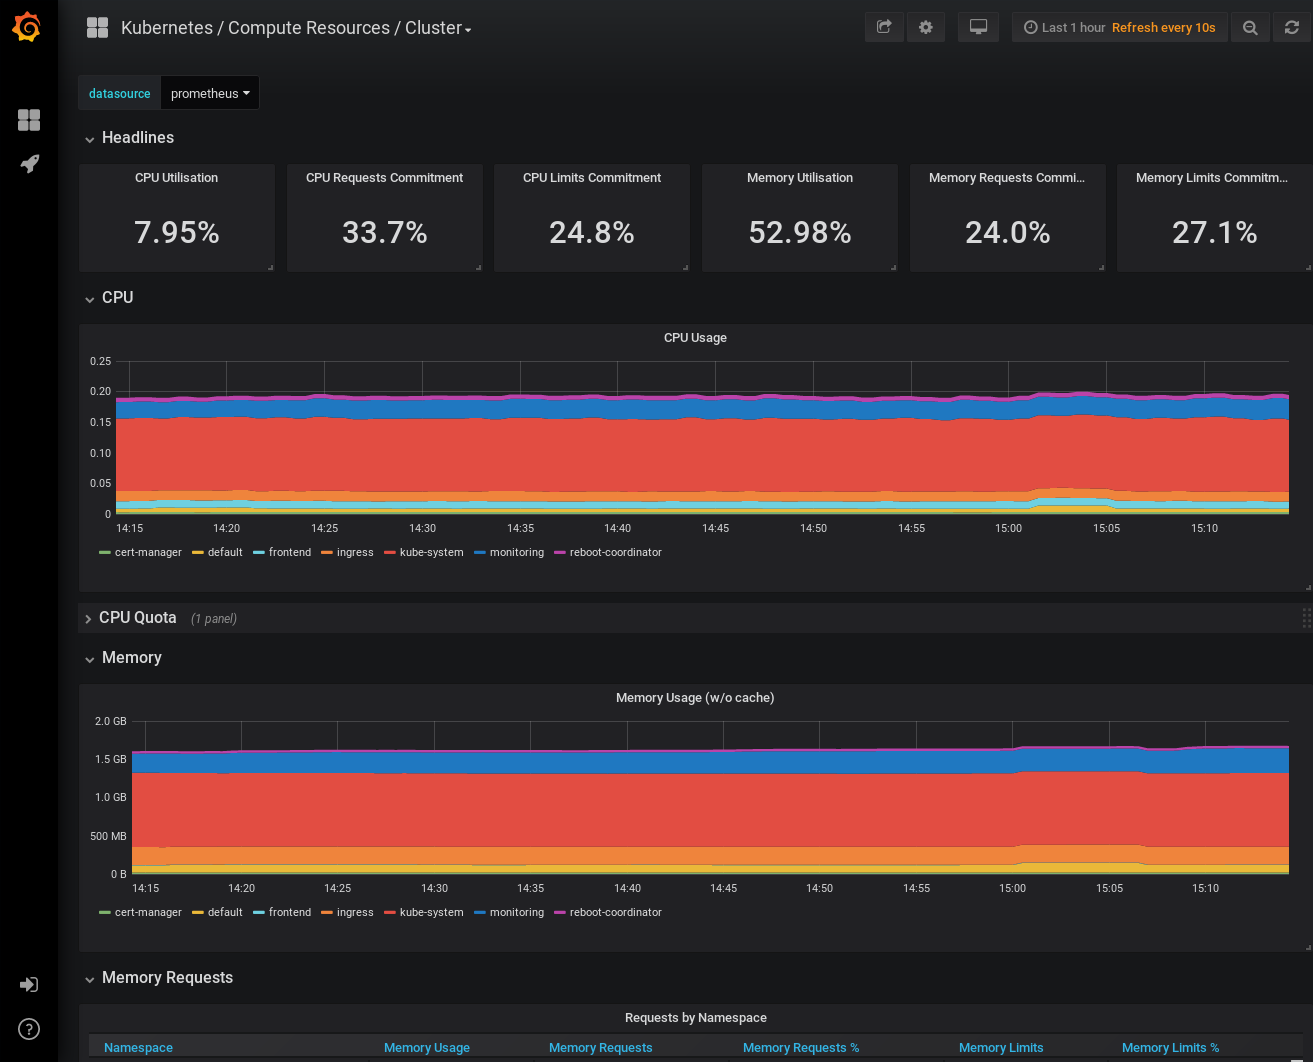
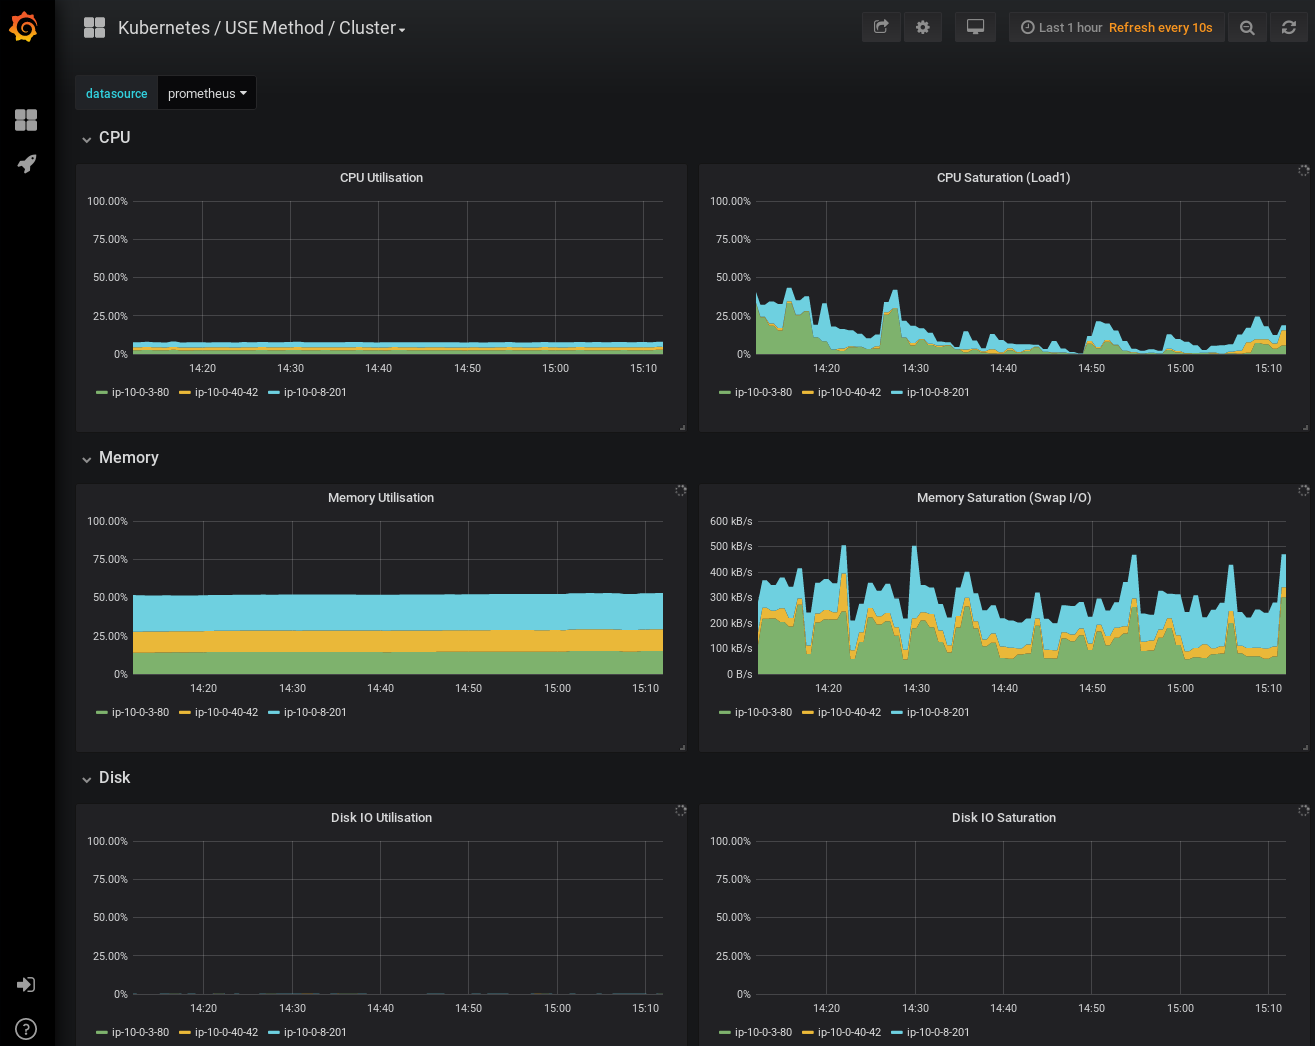
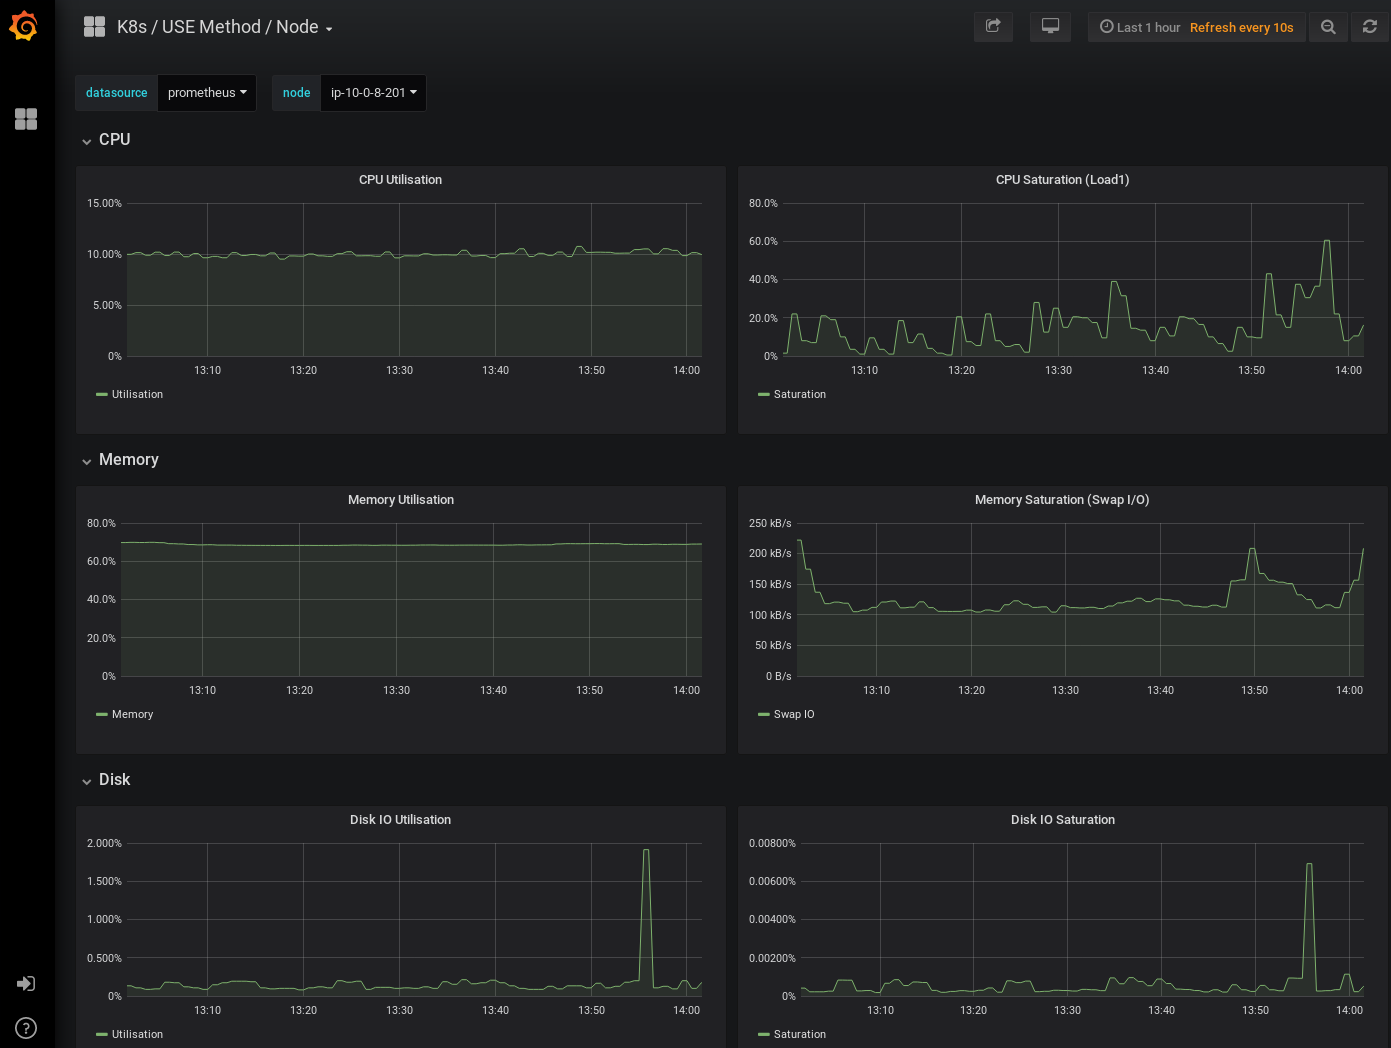
Visit 127.0.0.1:8080 to view the bundled dashboards.